Losing customers never stops being a downer. You put much effort and resources into conversions, only to see them go. While churn can’t be eliminated, it can be drastically reduced. In this article, you’ll discover what churn analysis is and how it helps brands minimize churn rates.
We all know by now that retaining customers is a must for businesses that are looking for growth.
Repeat customers are likely to spend more and are less costly to retain compared to acquiring new ones. If that’s not enough, there’s a good chance they’ll refer their friends your way.
That’s why you have to combat as hard as humanly possible against customer attrition.
And what better way to do that than by predicting who’s about to drift away and getting them back before that happens?
With the power of data and a dash of creativity, using churn analysis is your ticket to reducing churn and improving retention rates.
Here’s how it works.
| Want to jump ahead? What is churn analysis? How to calculate customer churn rates Essential KPIs to consider when evaluating churn How brands conduct churn analysis Why use churn analysis? |
What is churn analysis?
When a customer stops purchasing from your brand or using your services, we call it customer churn, turnover, or attrition.
Customer churn analysis is a multi-faceted approach to monitoring your customer attrition and retention performance that combines monitoring your customer churn rates with a deeper analysis of your customers’ journeys to identify the causes of churn.
Businesses use churn analysis to review their customer attrition rates and identify patterns or emergent issues. The process begins with examining your churn rates for various intervals using a basic churn calculation formula.
Before you delve deeper into the subject, read Why it is important to focus on customer churn rates.
Customer churn analysis goes beyond calculating churn rate, as there are other essential KPIs to consider when evaluating churn.
Let me tell you more about them.
How to calculate customer churn rates
There are several different formulas that businesses use to calculate churn. The formula below represents a commonly used method to calculate churn using net customer losses, or losses offset by customers gained over the same period.
(Customers lost ÷ total customers) for a designated period
Different versions of this formula use alternate methods to define lost customers and select the value representing total customers, such as a daily or per-period average.
Customer churn analysis involves more than just calculating your churn rate, though.
Essential KPIs to consider when evaluating churn
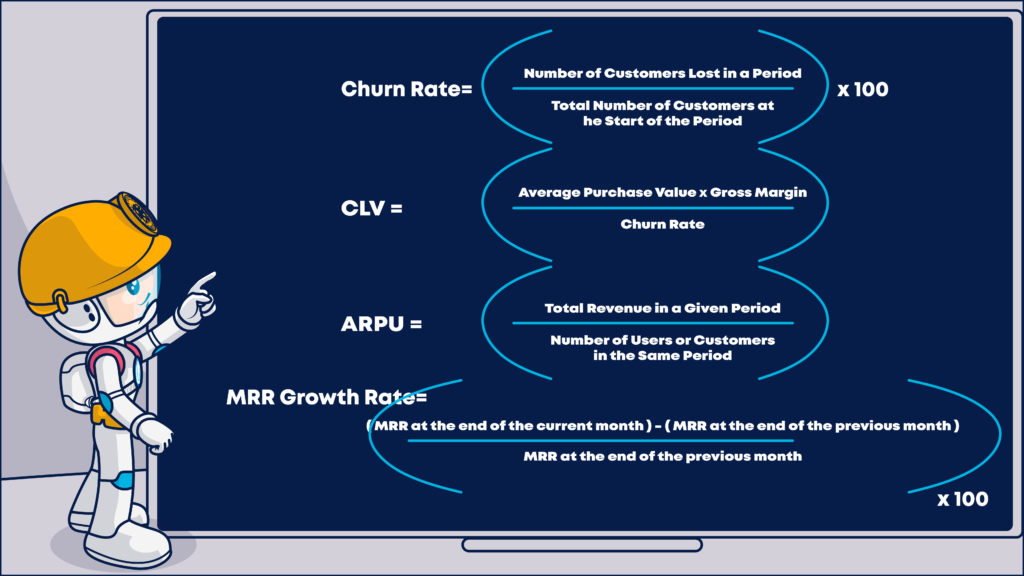
- Churn Rate:
Churn rate is the primary KPI and a critical metric for many businesses, especially those that rely on subscription models or repeat customers. It measures the rate at which customers stop using a product or service over a specific period.
It is calculated as follows:

- Customer Lifetime Value (CLV):
Customer Lifetime Value provides an estimation of the net profit from a customer throughout their lifetime relationship with the business.

This version of the CLV calculation is more practical and fit especially businesses where gross margin plays a significant role.
Average Revenue Per User (ARPU):
How much average revenue does each customer bring in over a specified period.
Here’s how to effectively analyze and look at ARPU:

To delve deeper into your analysis, consider segmenting ARPU by different user groups, demographics, or product tiers. This will help you identify which segments are the most lucrative and which ones require improvement.
MRR (Monthly Recurring Revenue) Growth Rate:
Think of it as your business’s heartbeat. It shows the pace at which your monthly revenue rises or falls, giving you a genuine feel for your endeavor’s well-being and growth potential
First, let’s get the MRR calculation right:
MRR=Total Number of Paying Customers×Average Revenue Per User (ARPU).
For the MRR Growth Rate, we will do as follows:

Revenue Churn:
This is the lost revenue as a result of customers churning.

These are just a starting point because many more KPIs are out there.
However, mastering these basics can serve as a springboard to delve deeper.
How brands conduct churn analysis
Churn analytics conducts an attrition retrospective identifying who left and why using spreadsheets or an analytics tool, such as Mixpanel or Baremetrics.
This deeper analysis draws from data about your customers stored in your CRM and other repositories to review your customers’ journeys and look for commonalities between the customers who left.
Predictive churn modeling takes these analytics (including your email ones) a step further, developing models to help businesses anticipate churn and score customers based on their likelihood of leaving.
Why use churn analysis?
Churn analysis looks back to keep you moving forward. Your churn analytics may offer you reassurance and confirm your assumptions or raise red flags.
The data gives your performance a check-up, identifies weaknesses in your customer acquisition funnel, and provides guidance for fixing leaks in your customer pipeline.
Customer churn is one of several key performance indicators (KPIs) that signal the overall health of your customer acquisition funnel from activation to advocacy. If you are gaining more customers than you are losing every month, then your business is growing.
Well, in theory, anyway.
In reality, many factors affect whether your business has the fuel it needs to grow.
You need to conduct churn analytics because churn rates alone don’t tell you the full story. For example, if the customers you retained are non-paying or have a low lifetime value in comparison to the ones you lost, your net revenue will suffer. You may even end up upside down with customer acquisition costs that exceed your per-customer value. 😬
Tracking your incidence of churn and its causes can diagnose the specifics of your situation.
Use segmentation methods to examine different customer cohorts and look at churn metrics by product lines, regional divisions, or other factors to gain granular insights into where customer attritions are happening and how much different churns cost to your business.
This information can help you separate good churn from bad, and bad churn from really bad churn.
A full churn analysis can help you determine whether you are better off trying to retain that customer cohort or cutting them loose and using their characteristics to define an anti-persona or exclusion segment.
Churn analytics also identifies the touchpoints and triggers that cause customer attrition, enabling you to implement preventive strategies.
Improve your customers’ experiences by using churn analysis to uncover their objectives and frustrations with your product or services, your customer follow-up care and overall experiences with your brand.
Finally, churn analysis is a predictive tool that can alert you to larger problems, such as poor product market fit, revenue declines, and intensified competition. Get ahead of pending threats and eliminate them before they can damage your trajectory.
“Those who fail to learn from history are doomed to repeat it.”
Churn analysis gives you actionable data to
- Reduce waste and inefficiencies in your sales process.
- Preserve and expand revenue.
- Increase customer loyalty and advocacy.
- Lower customer acquisition costs and improve your customer acquisition cost to lifetime value ratio.
- Improve customer experiences and build better products and services.
- Expand your customer base and protect your market share.
- Develop better-informed growth and retention strategies.
Predictive customer churn analysis empowers you to go on the offensive, investing in measures that stop losses instead of spending resources to recover from them.
When you combine churn analysis with your unique, proprietary customer data, you gain insights that no other business has.

